Malawi Maps
Understanding Malawi’s HIV landscape through spatial analysis
Built from multiple data sources provided by the Malawi Ministry of Health, these maps reveal fine-grained spatial patterns that shape how the epidemic unfolds across regions.
About the Maps
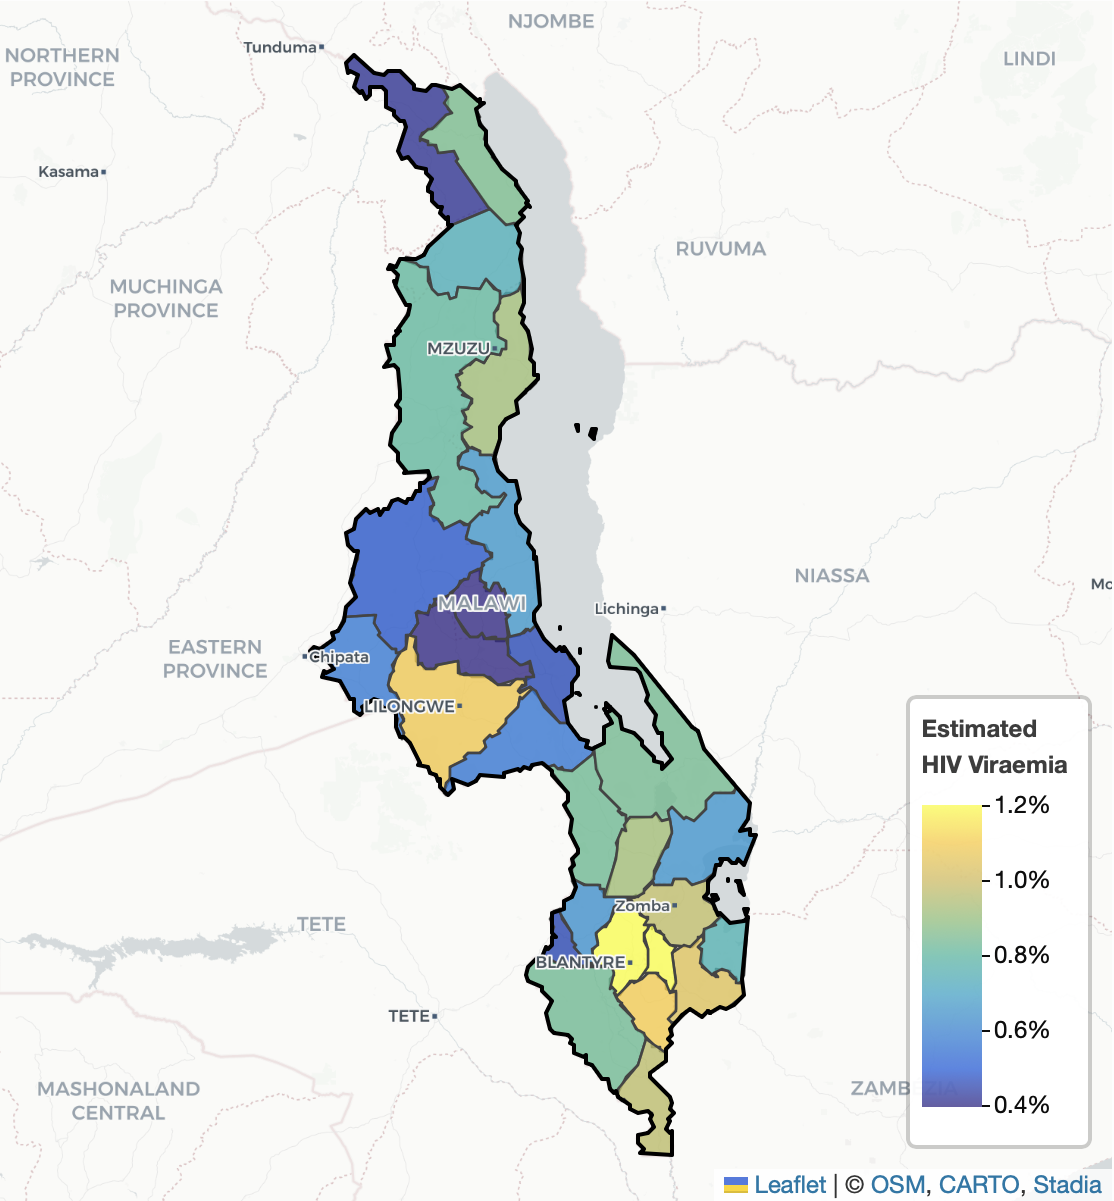
The below maps estimate variation in HIV prevalence, viral load suppression, and HIV viremia using population-based surveys and routine health surveillance data.
These maps visualize these estimates by administrative unit and by catchment areas for each health facility offering HIV services in Malawi.
Users can toggle between various levels of spatial resolution to identify differences in indicators by district, traditional authority, facility catchment, or group village head (a cluster of small villages).
When combined with local expertise, these maps can help to:
It is important to remember that maps are tools, not answers. Maps should be combined with knowledge of the local context for informed decision making.
Map Gallery
Explore interactive maps for each district in Malawi that highlight local patterns in HIV prevalence, viral load suppression, and viraemia.
Balaka
Blantyre
Chikwawa
Chiradzulu
Chitipa
Dedza
Dowa
Karonga
Kasungu
Likoma
Lilongwe
Machinga
Mangochi
Mchinji
Mulanje
Mwanza
Mzimba
Neno
Nkhatabay
Nkhotakota
Nsanje
Ntcheu
Ntchisi
Phalombe
Rumphi
Salima
Thyolo
Zomba
Acknowledgments
Lorem ipsum dolor sit amet, consectetur adipiscing elit. Integer nec odio. Praesent libero. Sed cursus ante dapibus diam. Sed nisi.